
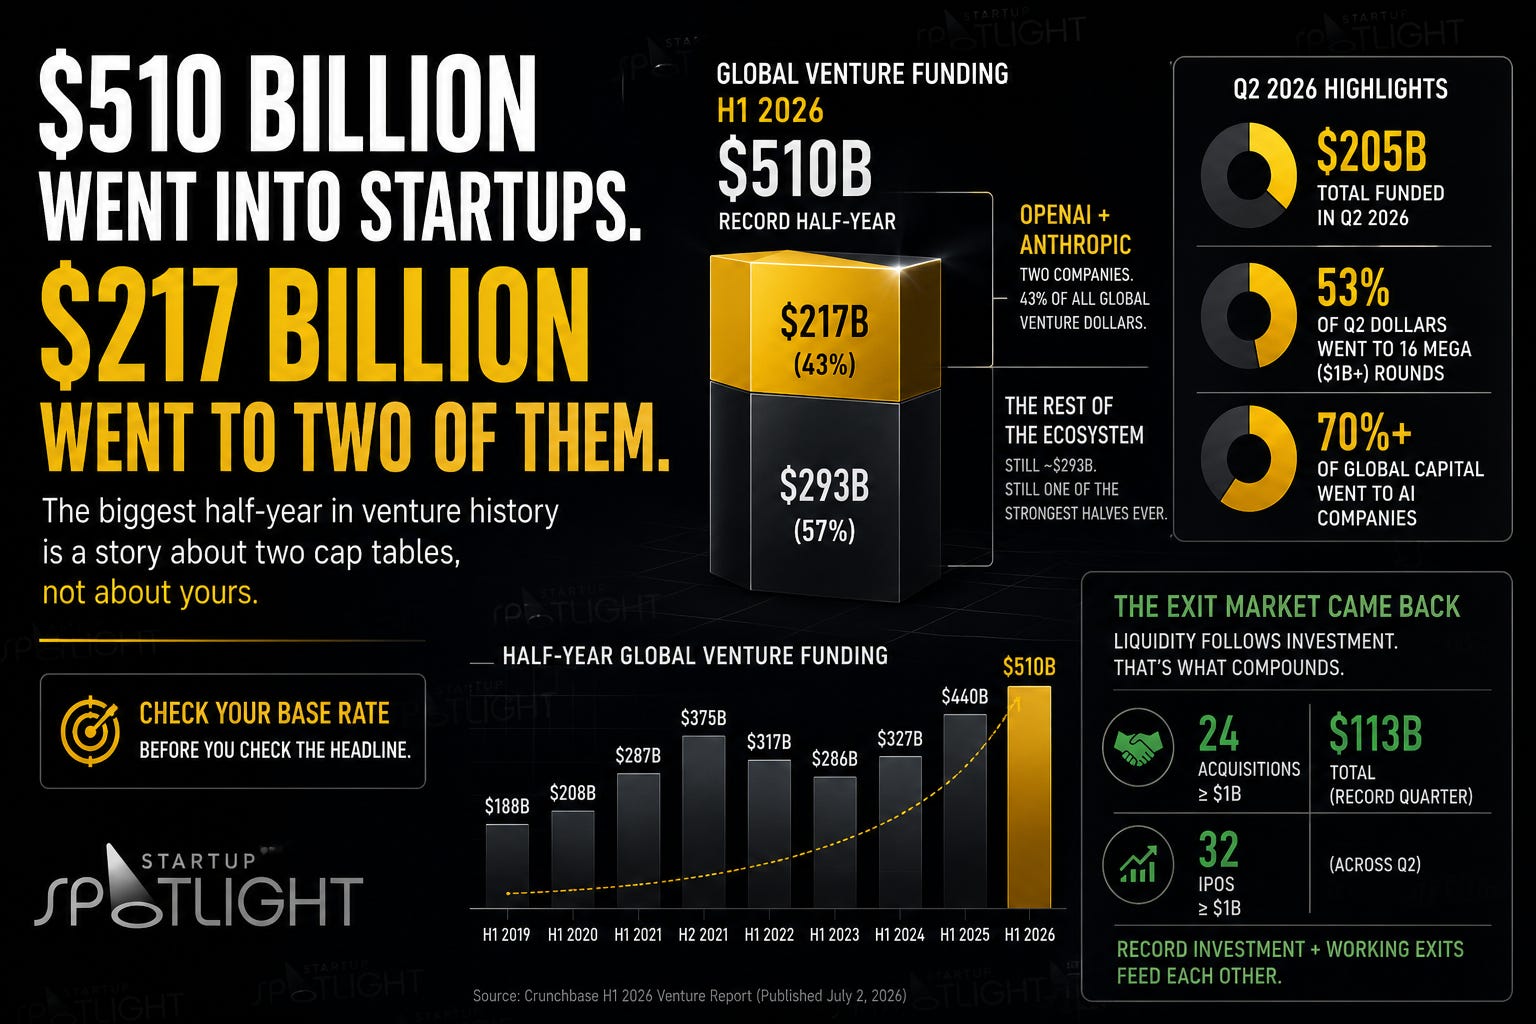
The biggest half-year in venture history is a story about two cap tables, not about yours.
Forty-three cents of every venture dollar deployed on Earth in the first half of 2026 went to two companies.
That’s the line from Crunchbase’s H1 report, published July 2. Global venture funding hit $510 billion in six months. That beats the $440 billion invested in all of 2025, and it blows past the previous half-year record of $375 billion set back in H2 2021. Q1 alone did $305 billion. Q2 added $205 billion.
Then the part that should stop you: OpenAI and Anthropic together took $217 billion of it. That’s 43% of all global startup funding in the half. Anthropic’s roughly $65 billion in Q2 was close to a third of the entire quarter, worldwide.
Zoom out one more click. Sixteen companies raised billion-dollar rounds in Q2, totaling $108.6 billion, which was 53% of the quarter. AI companies pulled more than 70% of global startup capital in Q2, up from just under 50% a year earlier.
So is capital back? Depends entirely on who you mean by “you.”
The model: Base Rates
A base rate is the underlying frequency of an outcome in a reference class you actually belong to. Most bad decisions come from grabbing the wrong reference class and running with it.
“$510 billion, record half” is the wrong reference class for almost everybody reading this. It’s the base rate for frontier AI labs backed by hyperscalers, and there are about two of those.
Do the subtraction. Take out the two labs and the rest of the ecosystem raised roughly $293 billion. That’s still one of the strongest halves ever, and it’s a completely different market than the headline implies. Take out the sixteen billion-dollar rounds too and you’re somewhere else again.
Founders who read “record venture funding” and walk into a raise expecting a hot market get punished. Not because the number’s fake. Because the number isn’t about them. The mean got dragged up by companies you’ll never compete with for a dollar.
Your base rate is your stage, your sector, your geography, your revenue. It is not the global aggregate.
Spence’s take
Here’s what almost nobody’s talking about, and it’s the more useful half of the report.
The exit market came back. Q2 saw 24 acquisitions at or above $1 billion, totaling $113 billion, a record quarter for M&A. Thirty-two companies went public above $1 billion. Crunchbase’s own framing is that record private investment and a working exit market feed each other.
That’s the line I’d underline. Funding records are a story about optimism. Exit records are a story about liquidity, and liquidity is what actually pays LPs, which is what actually funds the next round, which is what actually reaches you.
Everyone’s arguing about whether $510 billion means bubble or boom. Fair debate, and serious people sit on both sides. But it’s the wrong argument for a builder. The number to track isn’t how much went in. It’s whether anything comes back out.
That’s not a hot take. That’s just how capital works, and it’s the whole reason I care about structure at /mkt. Money going in is easy. Building the plumbing that lets it come back out, inside the rules, is the hard part.
Check your base rate before you check the headline.
If you want the mental models behind breakdowns like this, my book, Mental Models: How to Think, Act, and Win, is on Amazon now.


Startup Spotlight is for informational and educational purposes only. It is not investment advice, an offer, or a solicitation to buy or sell any security. Company metrics are self-reported, and funding details are drawn from public reporting and company statements. Figures may change.